As part of our effort to make management more efficient, we’ve been working on meaningfully monitoring what’s going on with our infrastructure.
Key word: meaningful. It’s one thing to just keep logs of everything. It’s another to make actionable insights.
And what’s more actionable than knowing what our clients need? As an Internet Service Provider, a core part of this is traffic.
To study what upstreams we need to optimize, we need to monitor where our traffic comes from and where it goes.
There are several tools out there such as pmacct, pNRG, FastNetMon, SolarWinds, as-stats — but after evaluating options, we chose as-stats.
Primarily because it’s free.
It’s also self-contained – just one component to deal with (as-stats) rather than linking multiple tools together (Grafana + InfluxDB + pmacct for instance)
Finally, it’s PHP-based. Our infrastructure is already mostly centered on Debian and PHP, so as-stats was right at home and in line with our technical competencies.
Oh, and APNIC has an existing blog post on the matter here. However, it’s outdated and lacks a lot of steps that took us several hours to deal with.
Without further ado,
Getting started with AS-Stats (on a modern system)
In order to make sure what I’m writing here actually works, I’m setting up as-stats again and documenting what I do in this post. I’m setting up a new VM in Proxmox — I’m going with
a Virtual Machine (I have not done this in a container, YMMV)
These settings, as they’re our standard for VMs:
Ubuntu 24.04.2 LTS from a Live Server ISO
q35 machine type (under System -> Machine)
Large SCSI disk with SSD emulation and Discard enabled
“Host” CPU type
And a network interface in the same LAN as our NetFlow source, for ease of setup.
We’re doing it from scratch.
Setting up a VM and installing an OS is out of this article’s scope.
Installing Dependencies
Usual update right after system install.
sudo apt-get update
sudo apt-get upgrade
I’m trying to go with the latest versions available in apt repositories. This means no PHP 8.4 as of writing.
sudo apt install librrds-perl librrd-dev rrdtool apache2 php8.3 make gcc git libapache2-mod-php8.3


# Required by Perl's Net:Patricia during compilation
sudo apt install libnsl-dev


# Required by as-stats-gui
sudo apt install php8.3-sqlite3


# For debugging
sudo apt install net-tools
Onto the Perl modules required by as-stats.
During the first module install, I got asked if I wanted to configure as much as possible automatically. I simply said yes.
I think this is because I’m using cpan for the first time?
Further, some of the modules take a while to set up due to compilation and such. I think it would be wise to run these commands individually.
sudo cpan install File::Find::Rule
sudo cpan install Net::sFlow     # Long install
sudo cpan install IO::Select
sudo cpan install IO::Socket     # Installed quickly
sudo cpan install Scalar::Util


# Not in APNIC guide, required by asstatd.pl
sudo cpan install JSON::XS
sudo cpan install Net::Patricia


# Not in APNIC guide, required by rrd-extractstats.pl
sudo cpan install DBI          # Installed in ~2 min
sudo cpan install TryCatch     # 26m 10.260s
sudo cpan install DBD::SQLite  # I stopped counting
There is a Perl module, ip2as, that needs to be installed manually.
First, I checked which version of Perl I had installed.
perl -v

This is perl 5, version 38, subversion 2 (v5.38.2) built for x86_64-linux-gnu-thread-multi
(with 44 registered patches, see perl -V for more detail)
# Required by asstatd.pl

# Install ip2as module
cd /usr/share/perl/5.38.2
sudo wget https://raw.githubusercontent.com/JackSlateur/perl-ip2as/master/ip2as.pm

# Get the current IP-ASN mapping. RRD files are not generated without this.
sudo wget -O /opt/AS-Stats/bin/ip.json https://asndb.network/get/latest/ip.json
Setting up as-stats
As per the APNIC guide, I went ahead and placed as-stats in /opt.
cd /opt/
sudo git clone https://github.com/manuelkasper/AS-Stats.git
cd /opt/AS-Stats
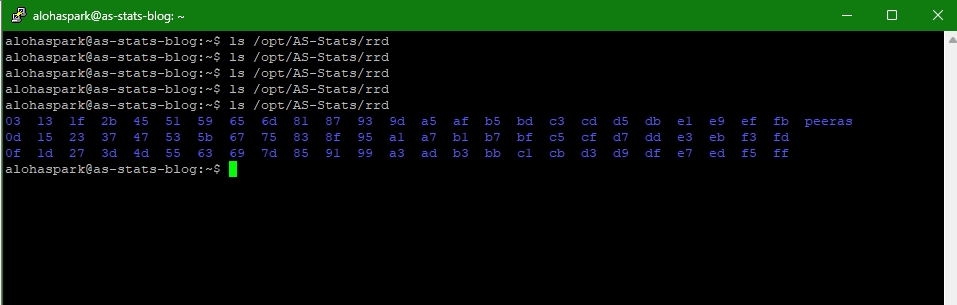
# Also create the directory for RRD storage
sudo mkdir /opt/AS-Stats/rrd
sudo chmod 0777 /opt/AS-Stats/rrd
I then modified the knownlinks file to reflect my current setup.
# nano, or your choice of text editor (vi?)
sudo nano /opt/AS-Stats/conf/knownlinks
I commented out all the 192.0 examples and put in the interface I was looking to monitor.
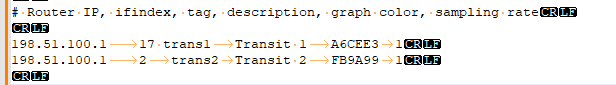
Now, here’s the thing with knownlinks:
The entries need to be delimited by tabs, not spaces. Take care when you copy your config from somewhere else.
For example, if you highlight text in putty, tabs may be copied as multiple spaces.
as-statswill throw an error if this is incorrect. It happened in my case. A quick way to check is by pasting your config into Notepad++ and showing all characters
View -> Show Symbol -> Show All Characters
After “17”, what seemed like a tab was actually a space.
ifindex is in decimal, and must reflect IDs as if collecting data via SNMP. In MikroTik, this ID can be acquired via the command
Running this manually gave the initial asstats_day file, which is important for the GUI later on.
APNIC suggests running this every hour, however I opted for every 10 minutes. I placed the schedule on the root crontab.
sudo crontab -e


# Then I placed the schedule every 10 minutes
#           */10 * * * * [command]


*/10 * * * * /opt/AS-Stats/bin/rrd-extractstats.pl /opt/AS-Stats/rrd /opt/AS-Stats/conf/knownlinks /opt/AS-Stats/asstats_day
Installing the Web GUI
I kept things as barebones as possible as this is really an internal tool. Simply put, I cloned nidebr/as-stats-gui into Apache’s root (located in /var/www/html).
cd /var/www/html/


sudo git clone https://github.com/nidebr/as-stats-gui


# To be safe
sudo rm -rf as-stats-gui/.git


sudo chown -R www-data:www-data as-stats-gui/
I then edited as-stats-gui/config.inc
# The important ones to edit are

# $rrdpath - Per ASN graphs are generated from here (weekly, monthly, etc.), I think

# $daystatsfile - Breaks the general 24 hour "home" page (but per-ASN view still works)

# $knownlinksfile - Everything breaks without this


$rrdpath = "/opt/AS-Stats/rrd";
$daystatsfile = "/opt/AS-Stats/asstats_day";
$knownlinksfile = "/opt/AS-Stats/conf/knownlinks";
And that’s it, really.
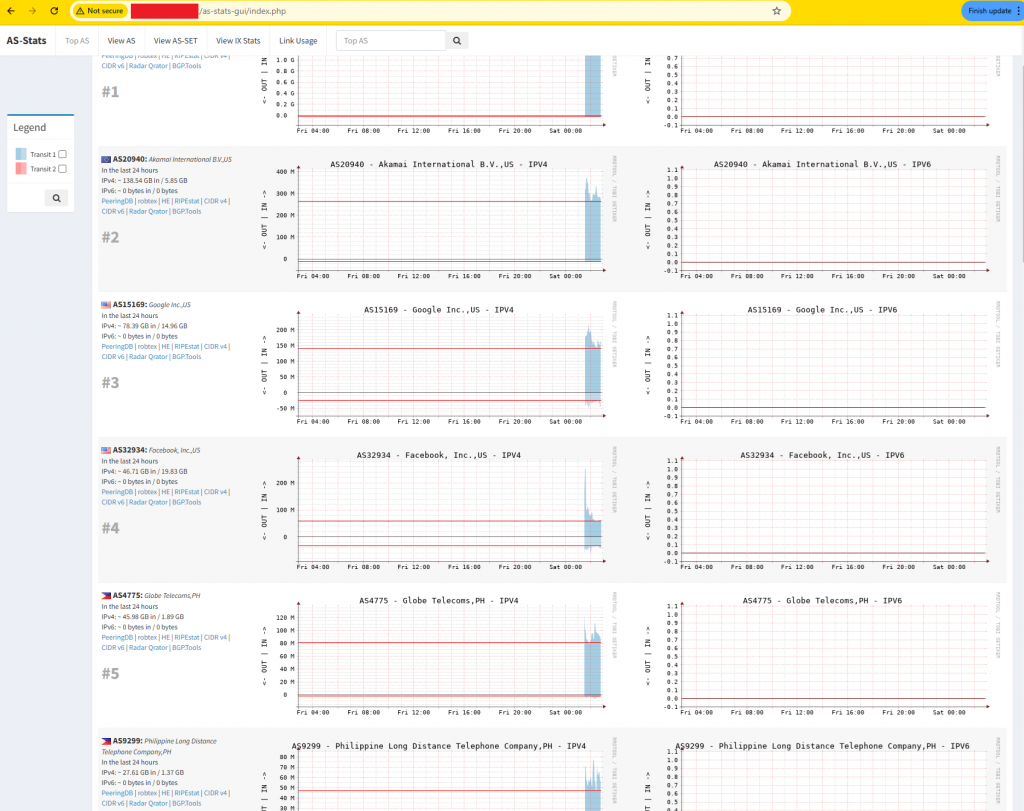
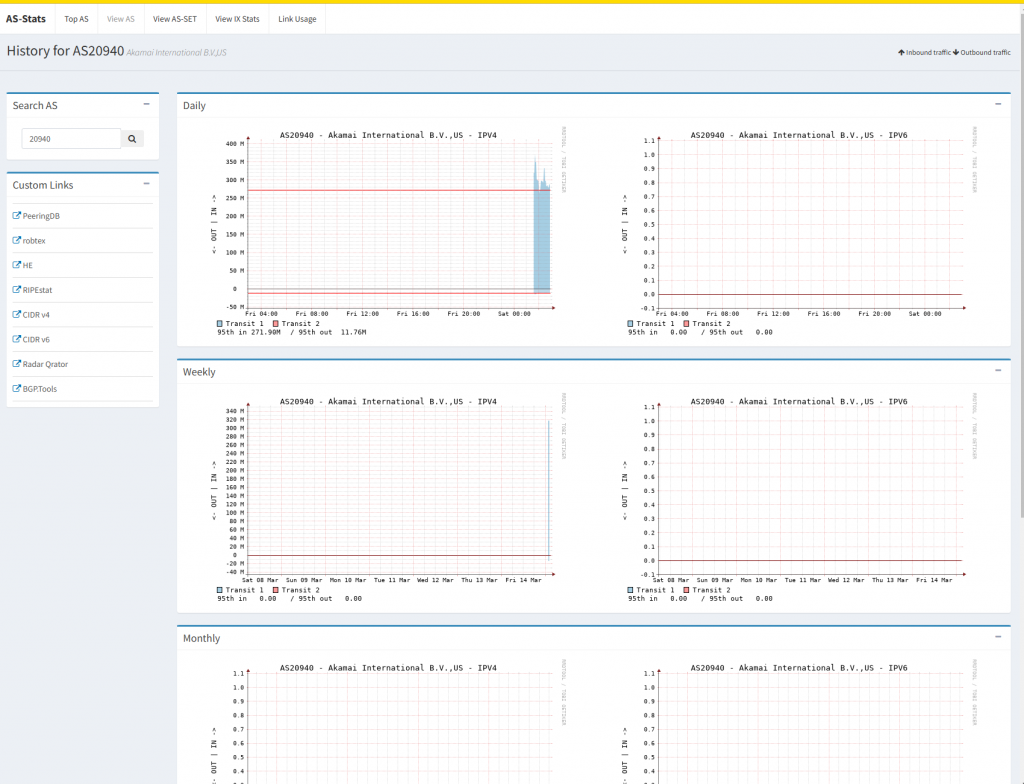
Accessing the IP address, plus the as-stats-gui path, gave pretty graphs. Now it took a while to have any data since this is a 24 hour view by default.
http://your-ip-here/as-stats-gui/
Clicking on one of the graphs opens up that ASN’s other timeframes (weekly, monthly, and yearly).
Setting up for headless mode
Running asstatd.pl in an always-open SSH console may prove to be inconvenient. For starters, the instance will die if the console is disconnected.
Therefore I set it up as a service.
I created a new file /etc/systemd/system/as-stats.service and placed our command earlier as a service:
sudo systemctl --no-pager status as-stats


# Expected output:
alohaspark@as-stats-blog:~$ sudo systemctl --no-pager status as-stats
● as-stats.service - AS-Status Collector
     Loaded: loaded (/etc/systemd/system/as-stats.service; enabled; preset: enabled)
     Active: active (running) since Sat 2025-03-15 03:07:11 UTC; 4min 18s ago
   Main PID: 164524 (perl)
      Tasks: 1 (limit: 4609)
     Memory: 470.8M (peak: 701.8M)
        CPU: 1min 11.374s
     CGroup: /system.slice/as-stats.service
             └─164524 /usr/bin/perl /opt/AS-Stats/bin/asstatd.pl -P 0 -p 9000 -r /opt/AS-Stats/rrd -k /opt/AS-Stats/conf/knownlinks -m /opt/AS-Stats/bin/ip.…

Mar 15 03:07:11 as-stats-blog systemd[1]: Started as-stats.service - AS-Status Collector.
alohaspark@as-stats-blog:~$
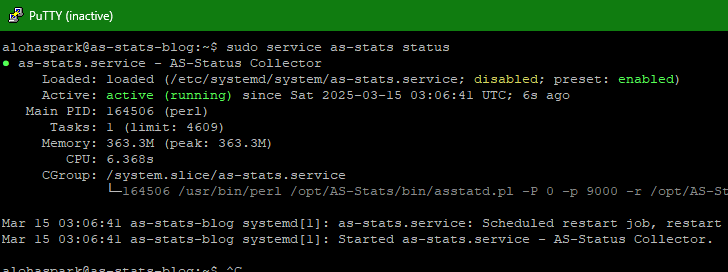
The “enabled”, in bold, signifies that this will run on boot. It would say “disabled” otherwise.
Disabled otherwise.
Summary and Conclusion
With as-stats now providing clear insights into our traffic flows, we are well positioned to optimize our upstreams, such as selecting a provider with a better path to our heaviest destinations.
Or better, we can strategically decide where and who to peer with.
As datacenter and transport costs continue to fall in the Philippines, it’s now practical to establish direct peering with content providers such as Facebook (Meta) and Google, significantly reducing transit costs by lowering usage.